Use the Ingest Usage Events endpoint to send usage events into Orb. Orb operates on the paradigm of events-based billing, where usage is calculated over raw events data. If you’re looking to get started with sending your first event to Orb, check out the Ingestion Quickstart Guide.Documentation Index
Fetch the complete documentation index at: https://docs.withorb.com/llms.txt
Use this file to discover all available pages before exploring further.
Events and metrics
A single usage event sent to Orb typically corresponds to either a user-triggered action or an axis of measurement, depending on your business. Each event is labeled with anevent_name, which conceptually identifies the action taken, as well as a user-defined dictionary of properties. Metrics are assembled by querying over events (of potentially different event_name), and can flexibly filter and aggregate on any property of the underlying events.
The following table provides some examples of events you might send to Orb based on the nature of your business, to illustrate how broadly an event can vary. In each case, the properties that you send alongside these names will determine your event’s full semantics.
| Business Domain | Event examples |
|---|---|
| Financial APIs | transaction_processedpayment_authorized account_linked |
| Cloud & Data Infrastructure | cluster_compute offline_storage network_ingress |
| Communications | message_transmitted call_processed recording_uploaded |
| Developer Tooling | async_job_runcontainer_uptime pipeline_execution |
| Integrations | source_connectedbatch_events_synced connection_health_refreshed |
| Analytics | active_user_loginevent_ingested query_compute_job |
Event volume and concurrency
Orb’s ingestion API is designed to manage high-volume, real-time use cases. Each individual call supports sending a batch of events. Individual ingestion requests can also be sent concurrently, which is useful in environments with multiple distributed reporters sending data to Orb that don’t require coordination. Orb provides per-event idempotency through the API to guarantee that duplicates are never processed within the account grace period. By default, Orb limits the request size to 500 events per batch. Please give our team a heads up if you plan to continuously send over 10,000 events per minute, so that we may provision dedicated throughput capacity. The ingestion API (regardless of the integration mechanism) is designed to scale to tens of millions of events per day. If your use case requires more event capacity, Orb offers a high throughput option that performs rollups and scales to orders of magnitude more events while still providing the same idempotency and real-time guarantees. To ensure that test mode workloads do not affect live mode availability or performance, the ingestion API will be limited to 2000 events per minute and 10 requests per second for test mode events. Note that significantly higher throughput, by orders of magnitude, is available in production environments.Determining event schema
Metadata passed in viaproperties to Orb does not have to conform to an up-front decided schema, and you can specify any number of tags or labels that might be relevant to billing. Each event should include properties required to compute an aggregate on the basis of those events.
You’re encouraged to send additional metadata, even if it’s not immediately useful for billing in the short-term. Additional event properties may be used for future metrics you want to build, or formatting invoices (e.g. if you provide a region property that doesn’t affect prices, your invoices may still employ it for grouping line items). Sending those properties in your initial integration will help avoid backfills and amendments.
In the Financial APIs use case above, the entirety of the event might look like:
Tracing ingested events
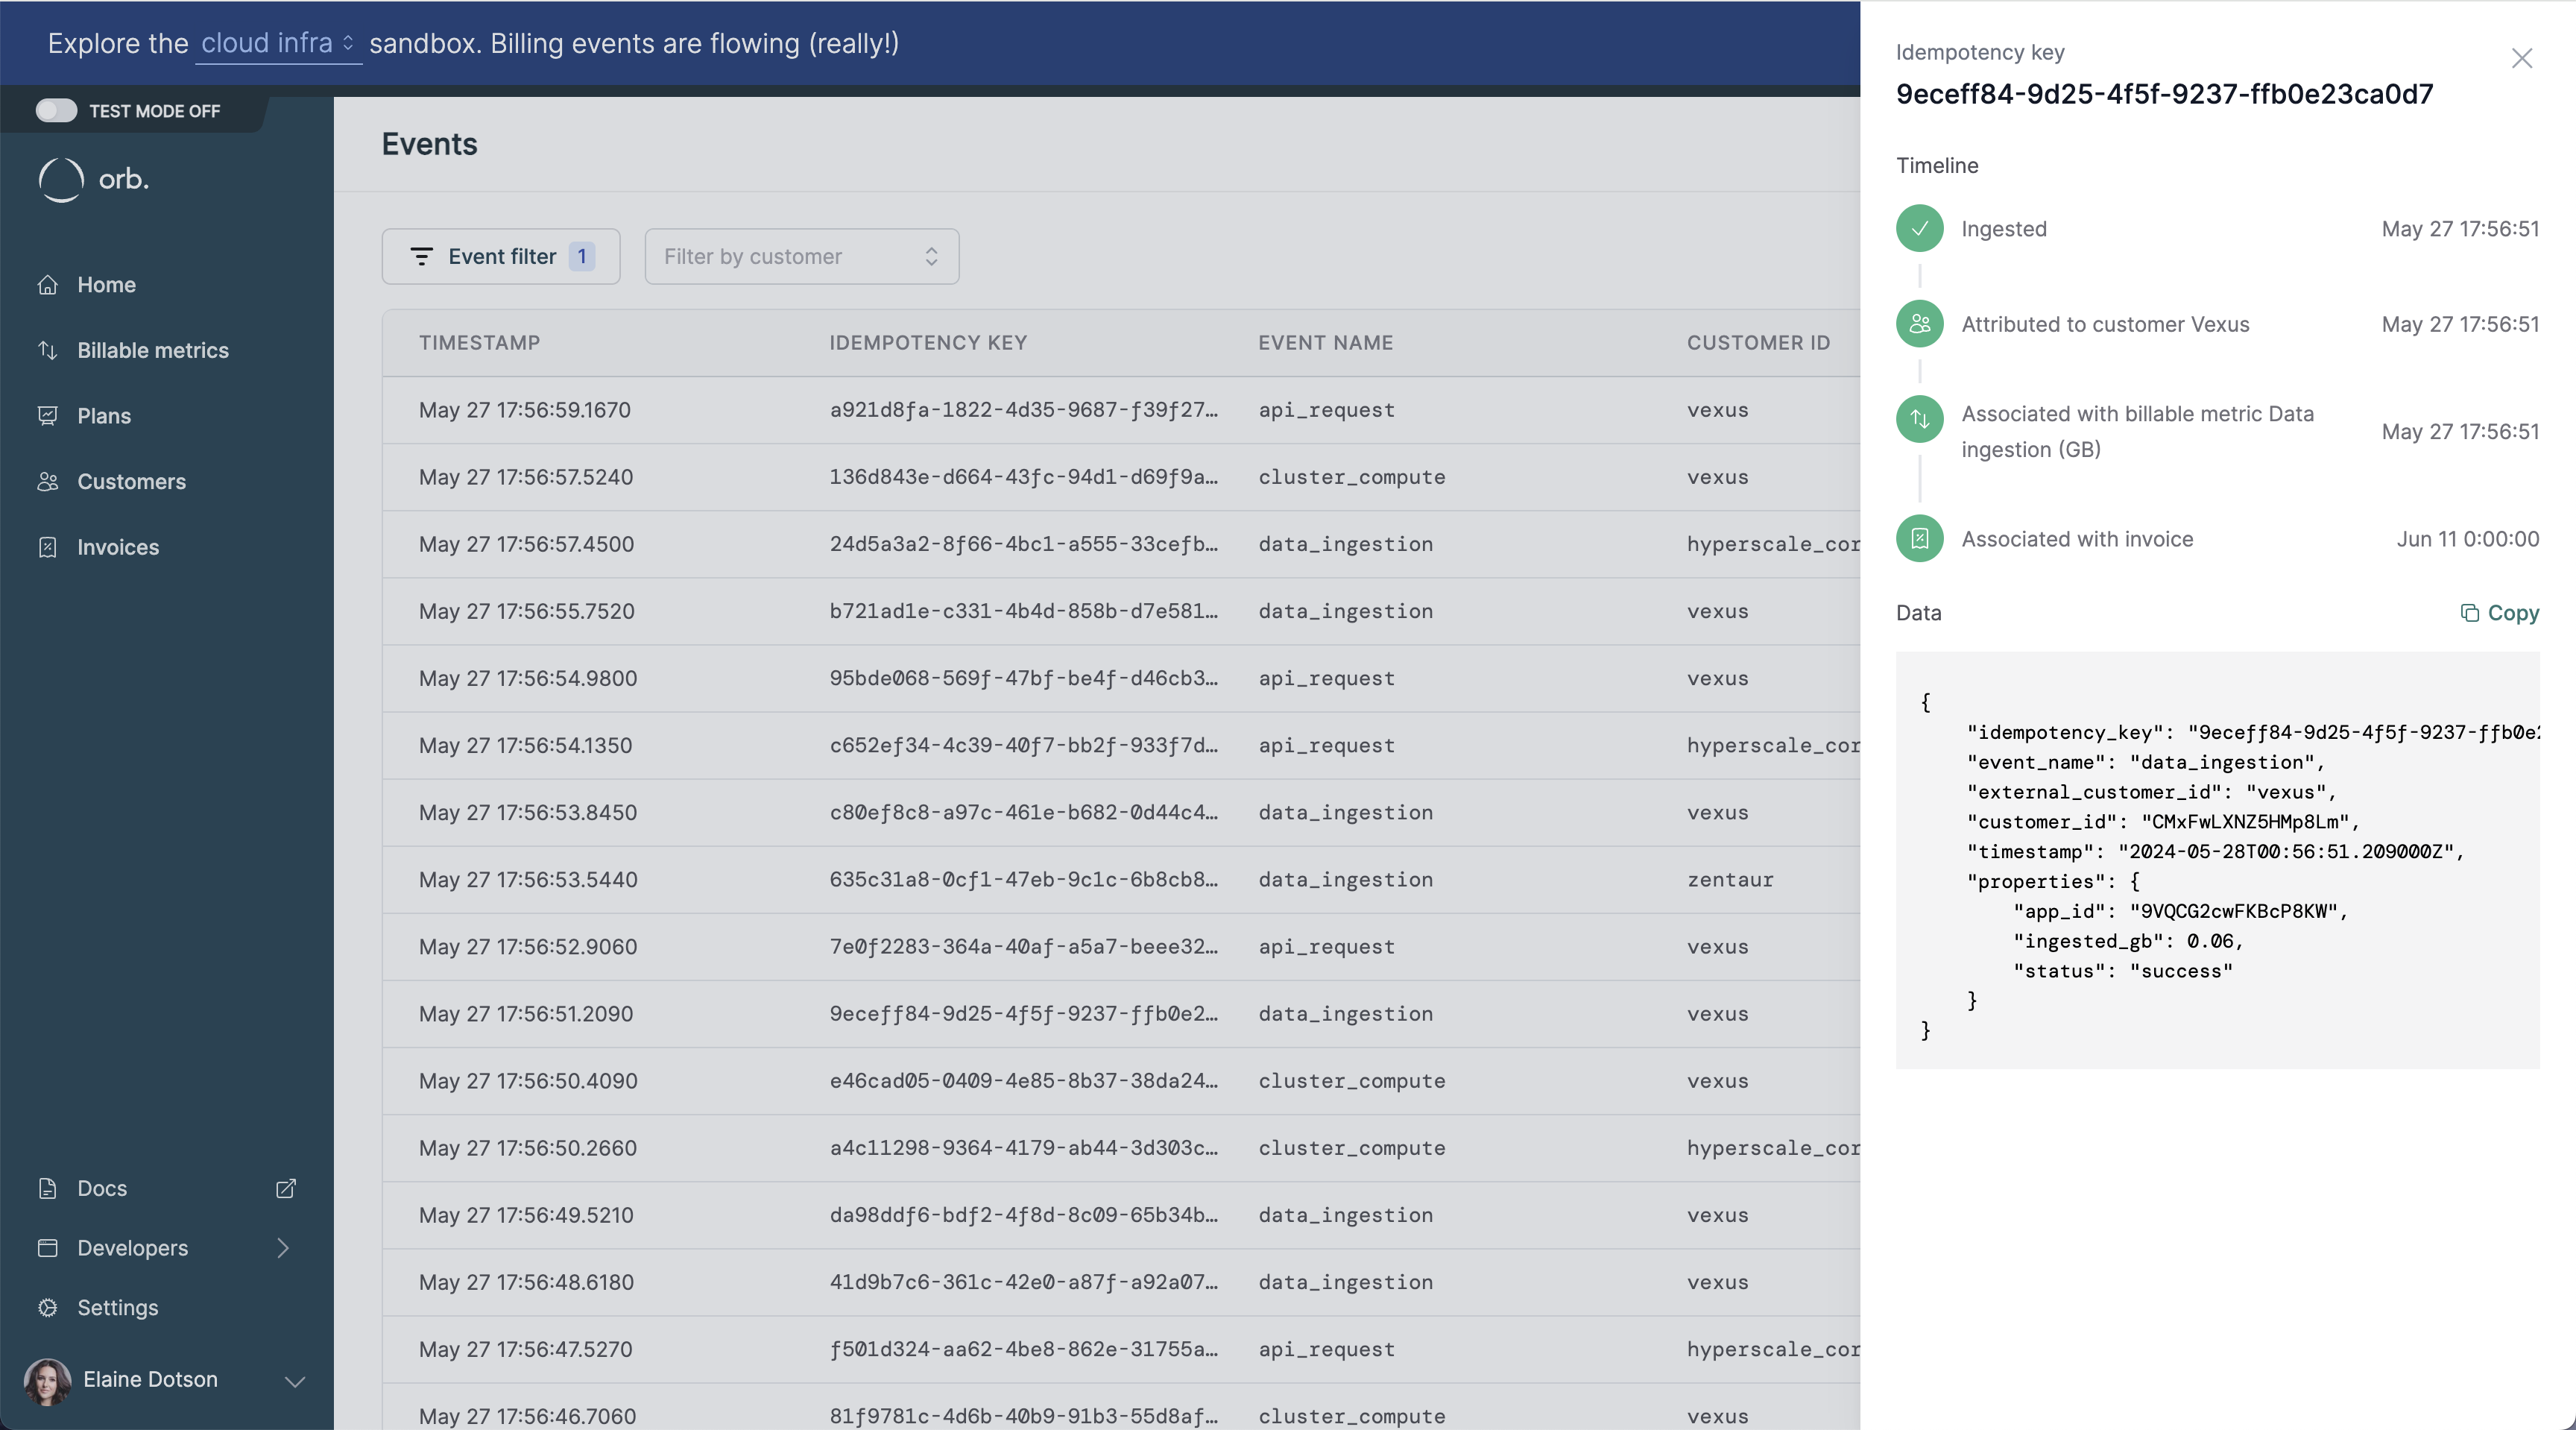
Events themselves can be inspected in Orb via a trace view. This can be helpful for understanding how events are being processed, or in order to test your integration. This view includes:-
A full view of the event, including the
propertiesthat were sent with the original payload - Attribution information to the Orb Customer
- Information about whether the event contributed to an active subscription, and if it led to a deduction for pre-paid plans
- How the event contributed to the invoicing cycle, past or upcoming

Integrations for event ingestion
Orb supports multiple different ingestion strategies to maximize the ease and efficiency of your integration. In addition to the primary ingestion endpoint, events can also be ingested via the following integrations.| Integration | Setup required |
|---|---|
| Segment | Add Orb as a destination in Segment and set up event mappings to the Orb event schema. Orb automatically ingests track calls from Segment. |
| Reverse ETL, e.g. Census or a Custom Hightouch destination | Our team can help you deploy your Custom API for a new SaaS destination (saving your team the effort to build the middleware that returns a synchronization spec and communicates with Orb endpoints). |
| S3 / GCS Integration | Set up an S3 bucket; Orb will handle listening for event notifications for files added and automatically manage file-level idempotency and API retries. |
| Logs Infrastructure (e.g. Kinesis, Cloudwatch) | Set up a Lambda that runs within your VPC, and/or a Cloudwatch filter to send a subset of logs to Orb in a cloud storage bucket. |