What is a simulation?
Simulations allow you to visualize price changes in Orb before you make them, without any of the billing risks associated with traditional price experimentation. Because Orb sits at the unique intersection of your product usage and revenue data, Simulations have a number of powerful applications, including:- Backtesting to de-risk price changes
- Forecasting for new product pricing
- Churn prediction and prevention
Orb Setup
To use Simulations, make sure you’re first up and running with Orb. Orb’s Quickstart guide can help you get started. Specifically, you’ll need to:- Ingest events: this gives Orb visibility into your product to power the simulation
- Define a billable metric: this models the specific change / new price(s) you’re introducing
- Have a plan with subscriptions: this is how you’ll define the cohort parameter for your simulation
Creating a simulation
Step 1: Define simulation parameters.
Name your simulation for easy reference, set a time frame, and select a plan to run your simulation over. This determines the actual historical data that will be used in your simulation. Ensure you define parameters that provide sufficient, and representative data.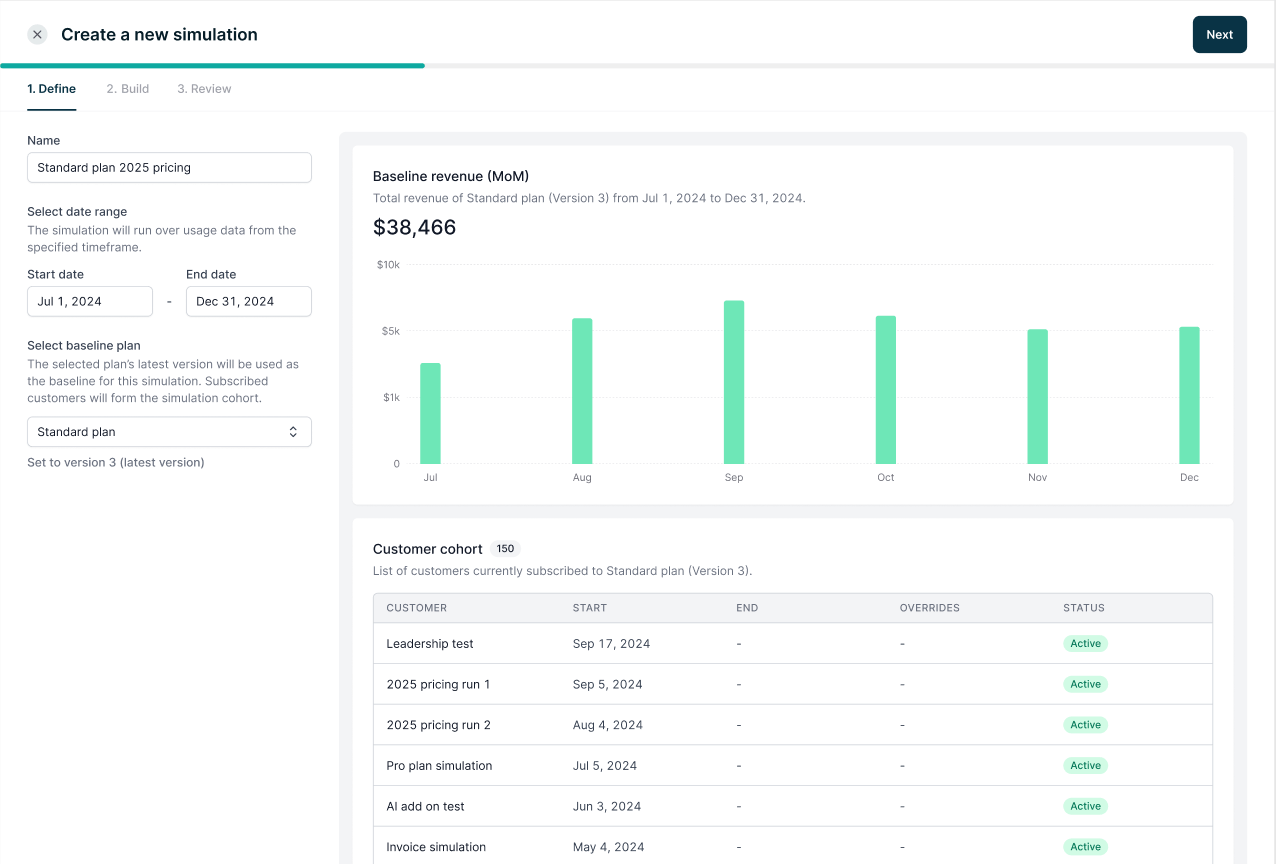
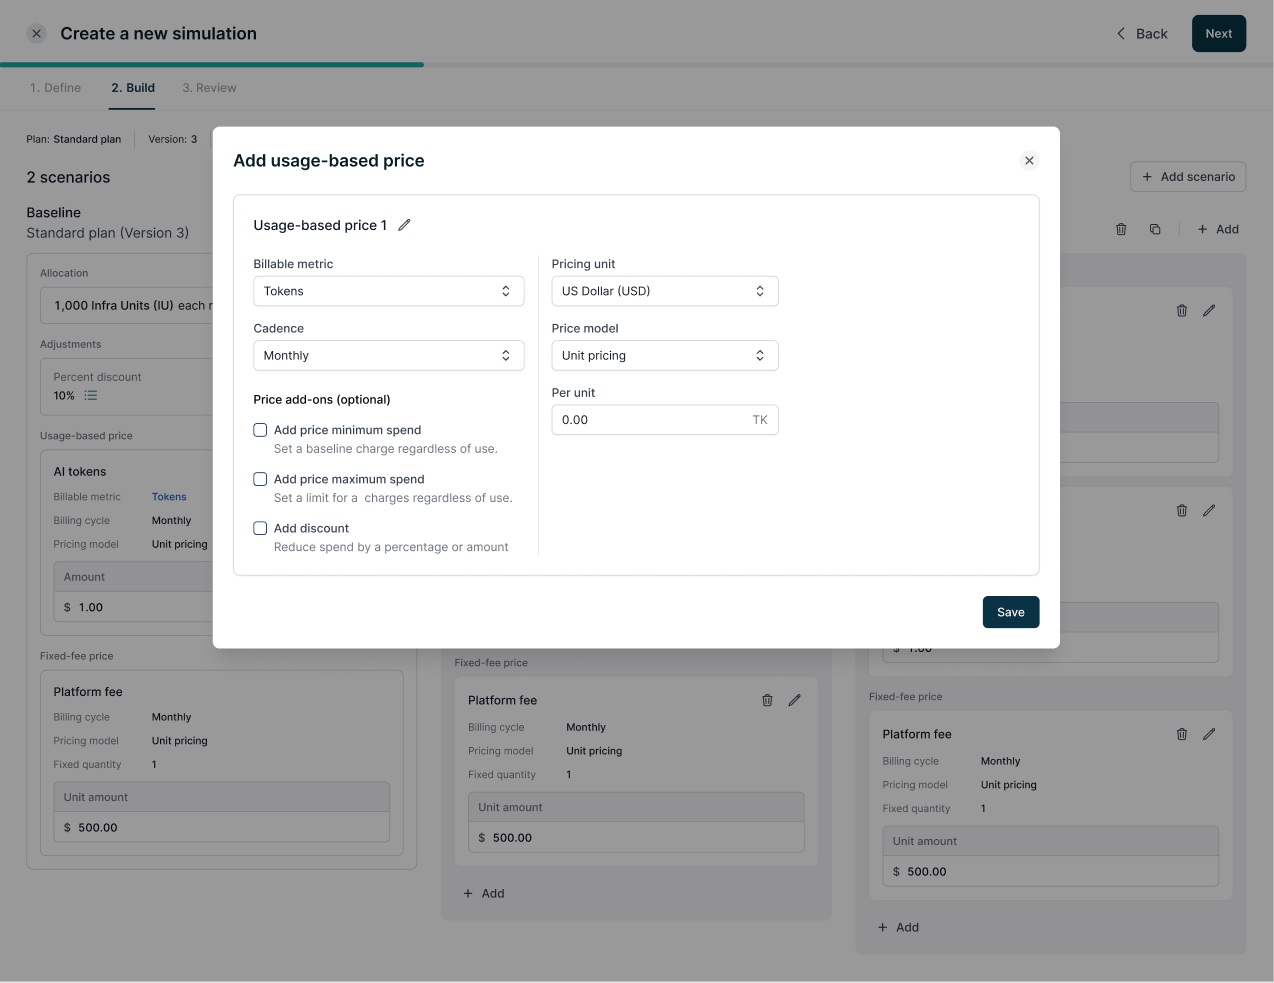
Step 2: Create one or more scenarios to simulate.
A scenario represents a hypothetical price change you’re considering.- Usage-based prices are best used to model prices that scale with variable events like costs, product actions, and/or outcomes.
- Ex: tokens consumed, conversations started, resolutions achieved.
- Fixed fee prices best represent a platform fee or minimum spend, typically used for capturing upfront revenue.
- Optimize the price point: create a scenario, then duplicate and assign different rates.
- Determine your value metric: create multiple scenarios for different value metric candidates - one per usage-based price to be considered.
- Choose a pricing strategy: create multiple scenarios to evaluate different strategies like standalone usage-based pricing vs. hybrid usage + fixed fee pricing.
- Choose a pricing model: create multiple scenarios to evaluate different price models like unit vs. tiered pricing.
Step 3: Run the simulation.
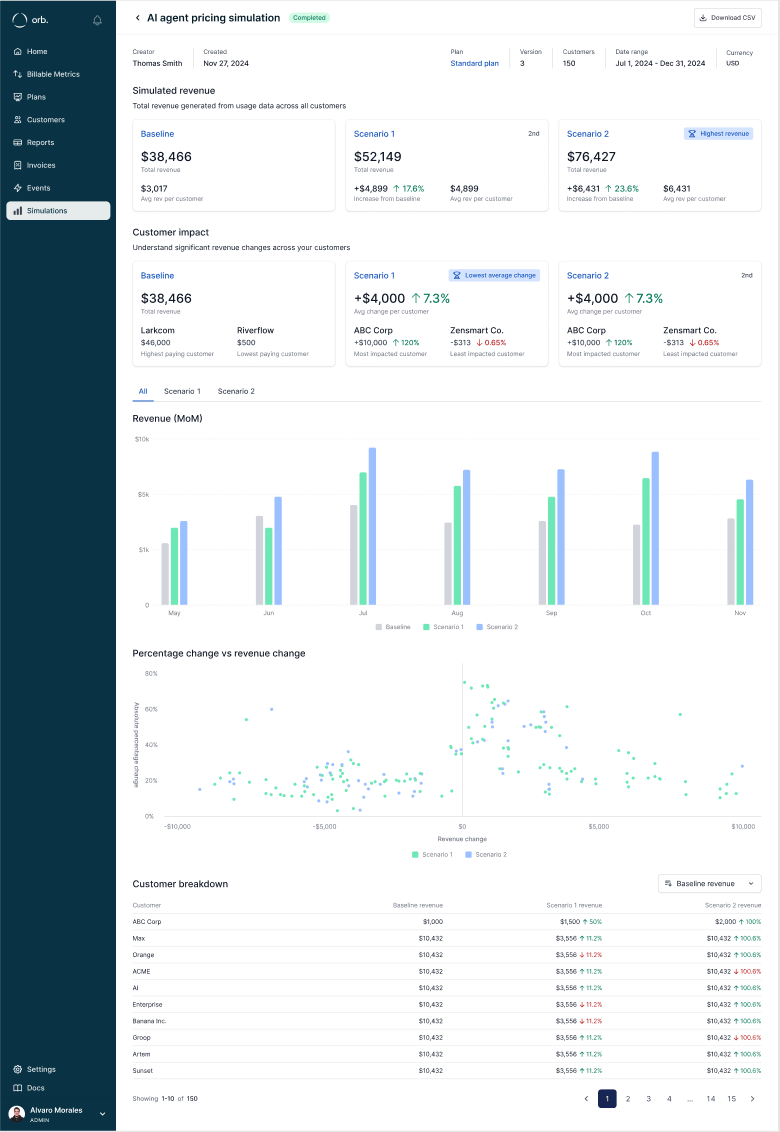
You’ll receive an email when your simulation is complete and insights are ready for review.Actioning on insights
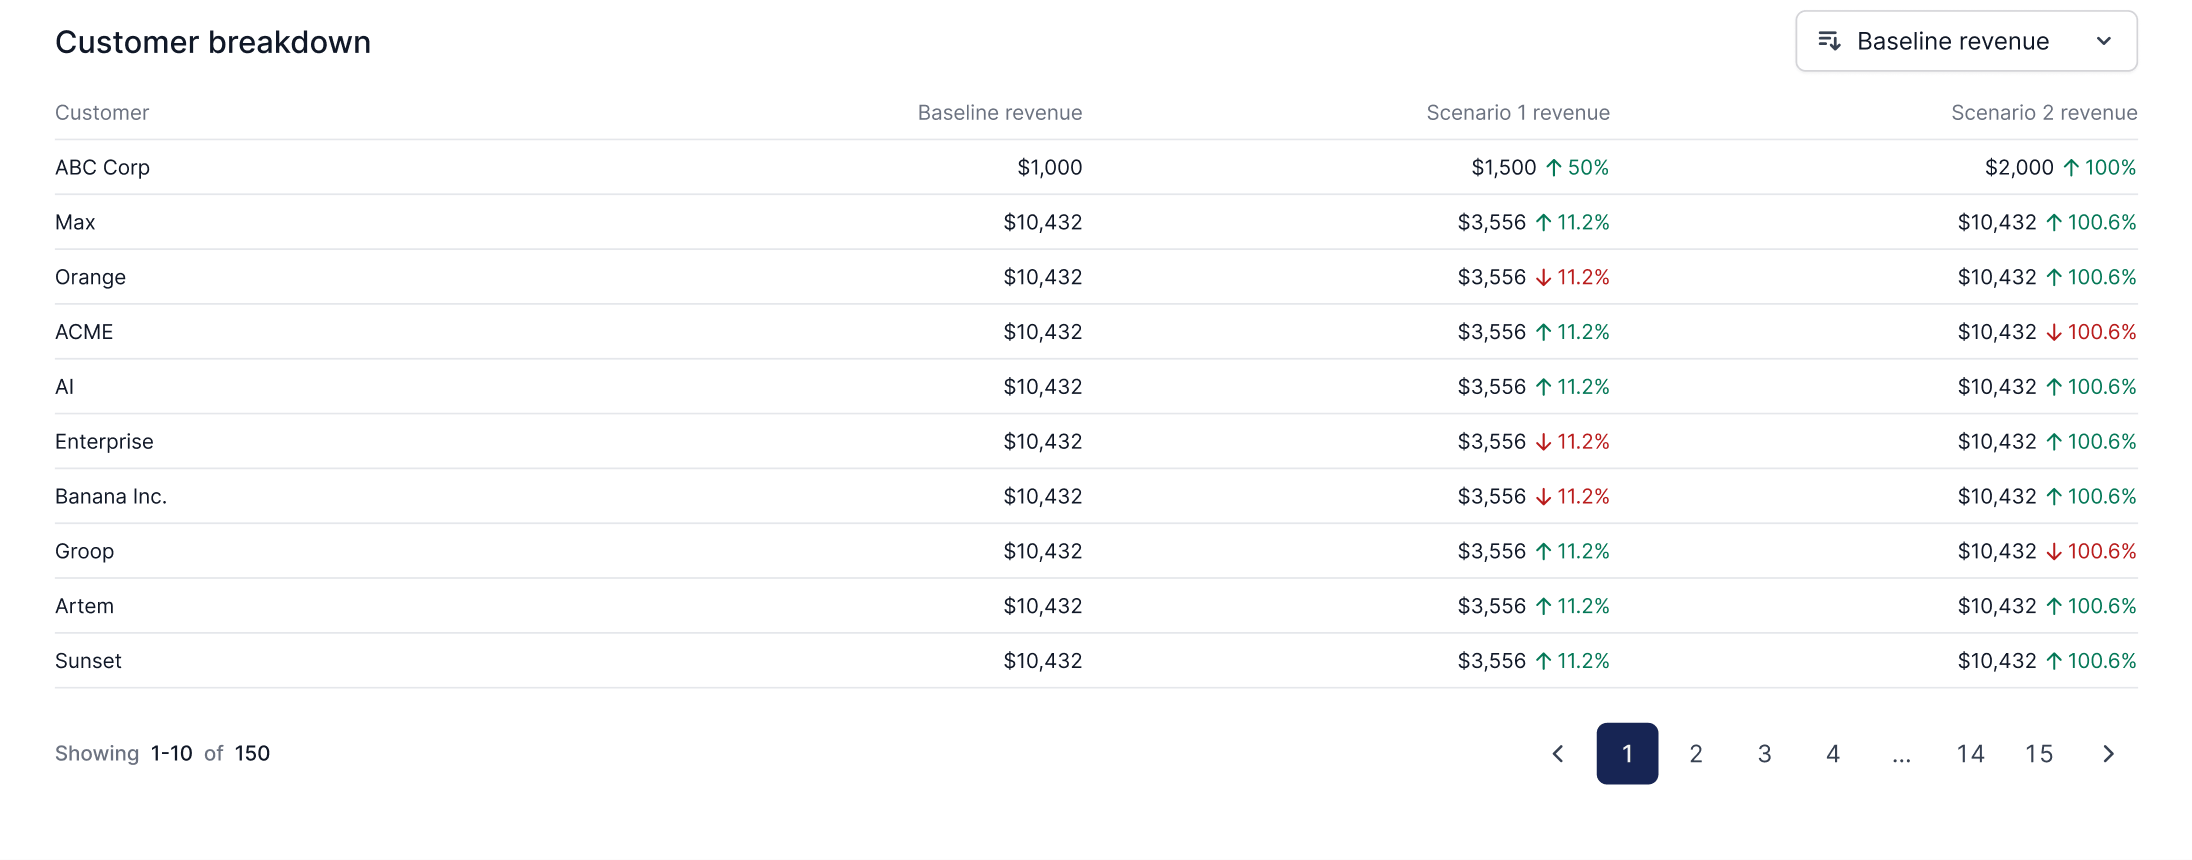
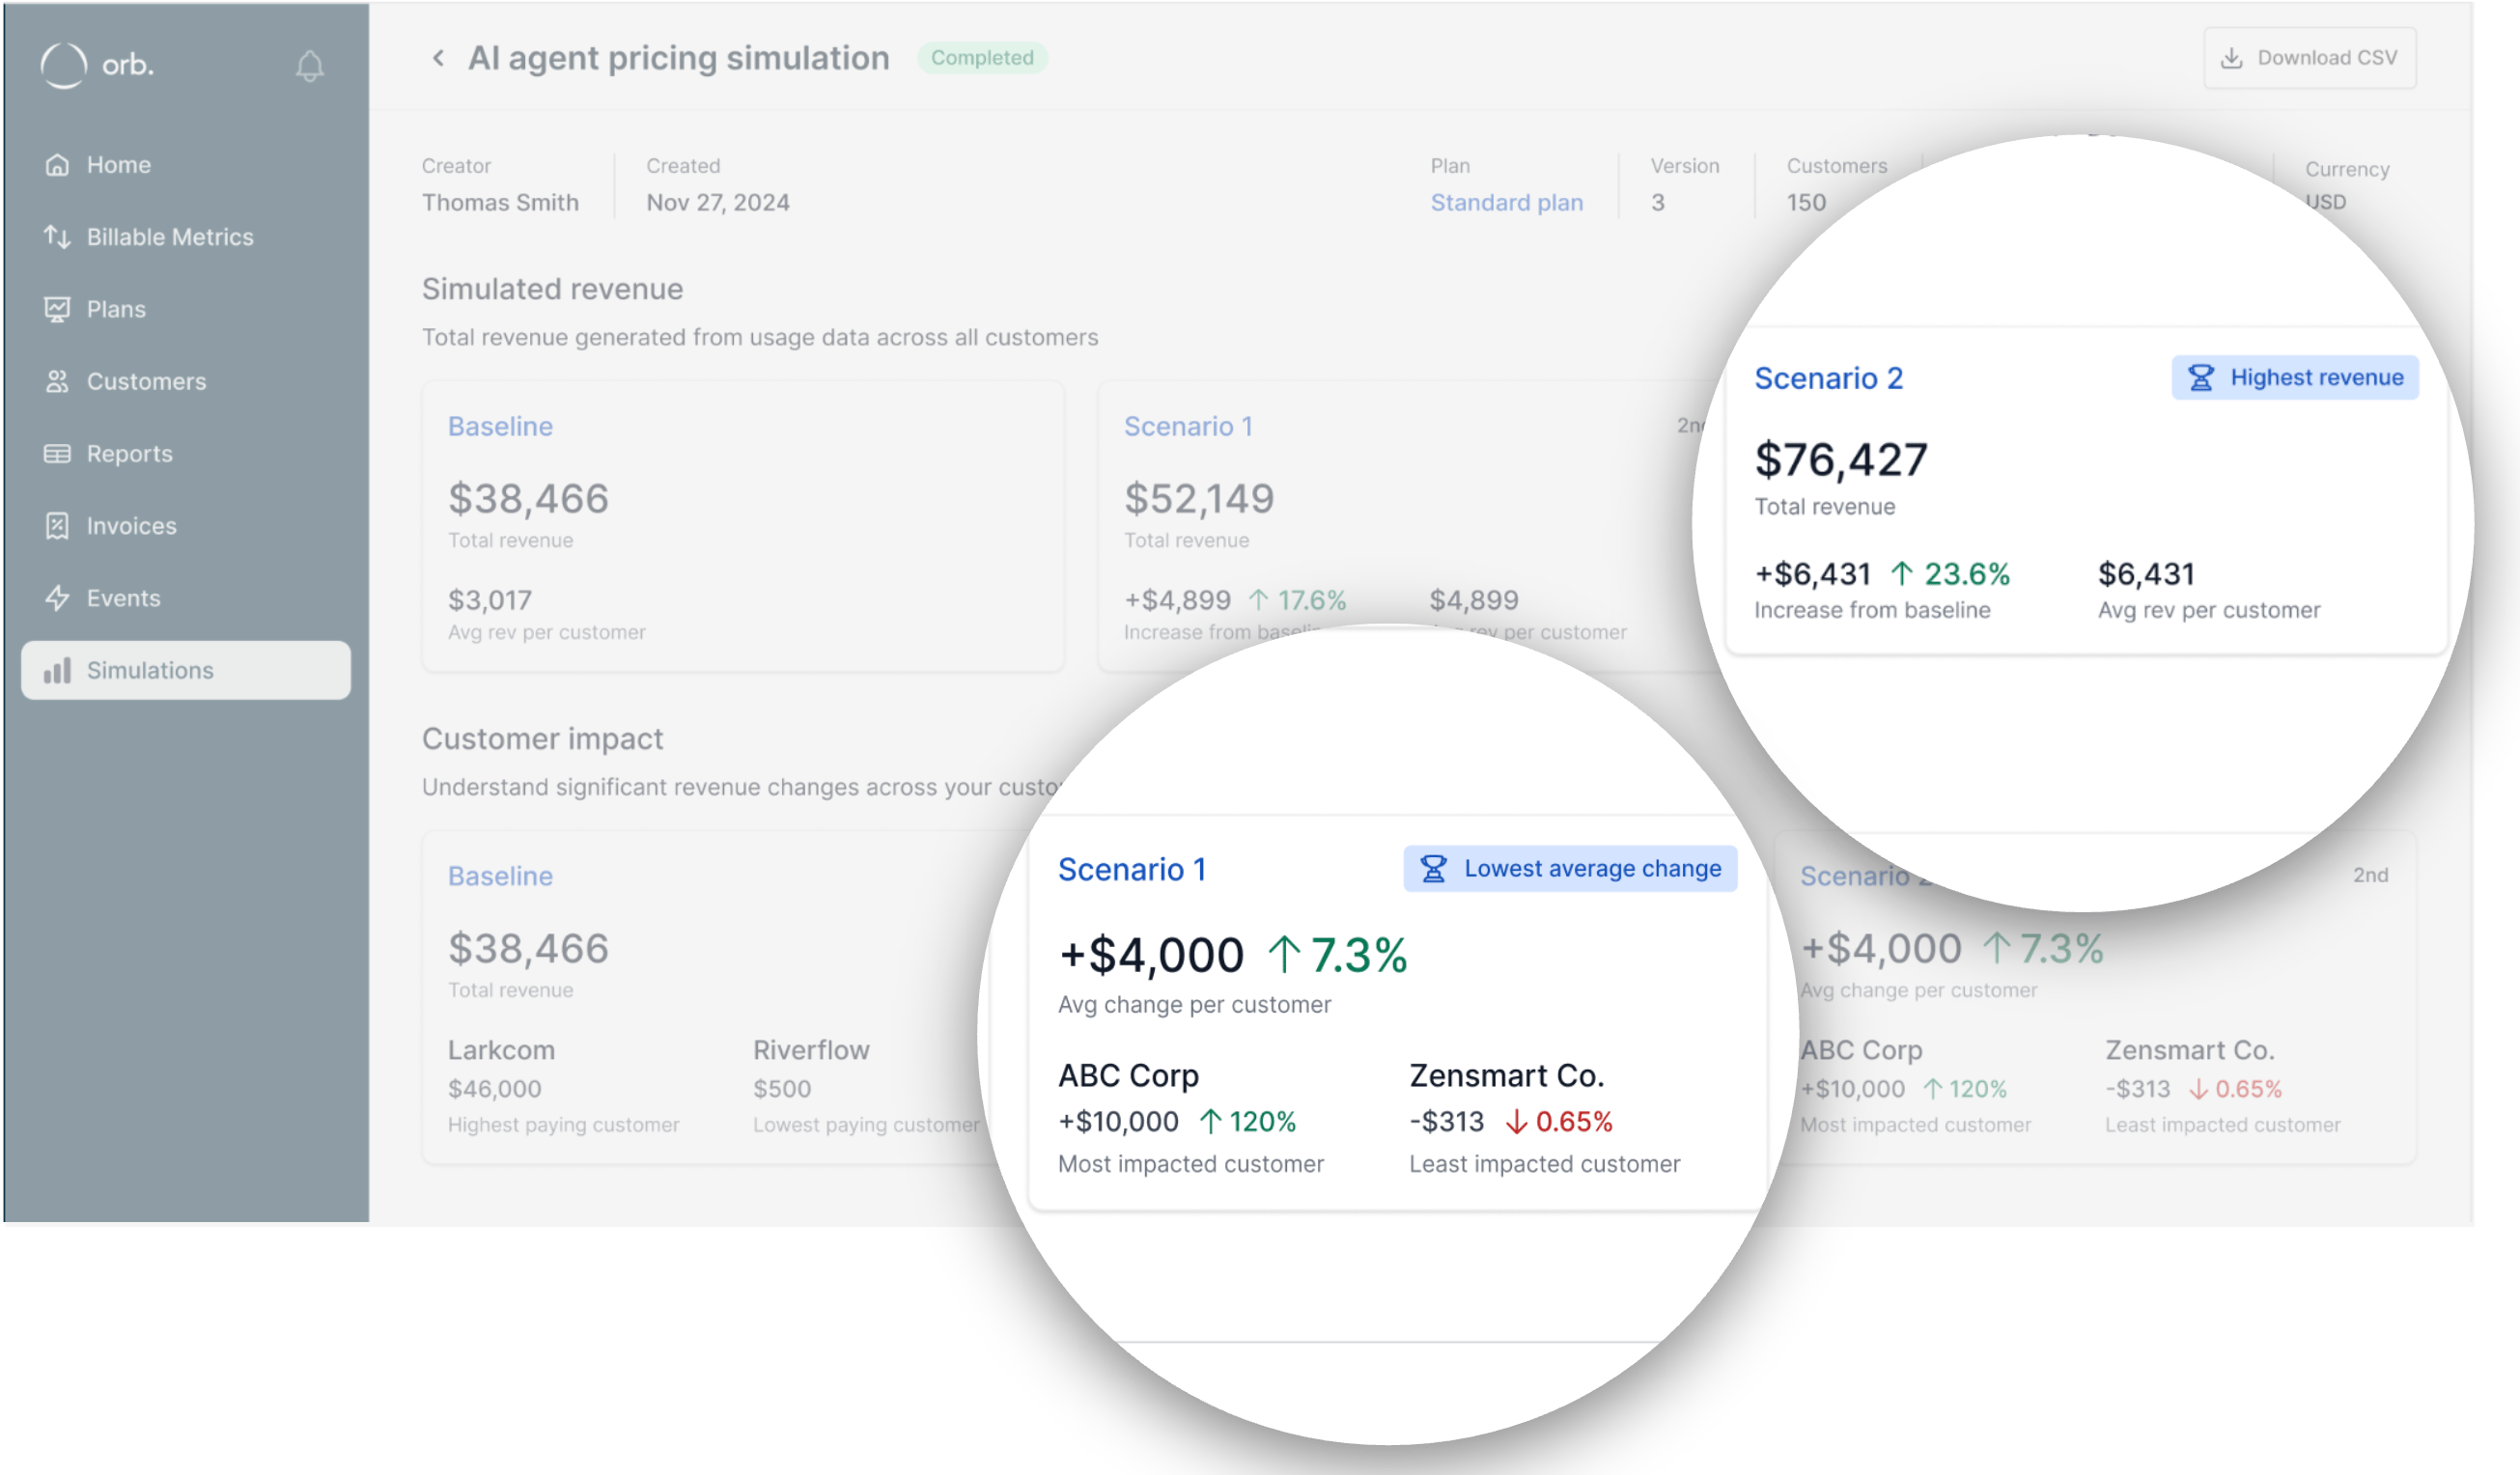
The results of your simulation are designed to help inform your decision on how / if to implement your price change. Key revenue and customer risk impacts associated with your changes are highlighted for consideration, replacing the tedious spreadsheet alternative and freeing up valuable Finance and Bizops resources.Top-line insights
Use the summary of your simulation inputs (scenarios and parameters) to refresh on context for what went into your analysis.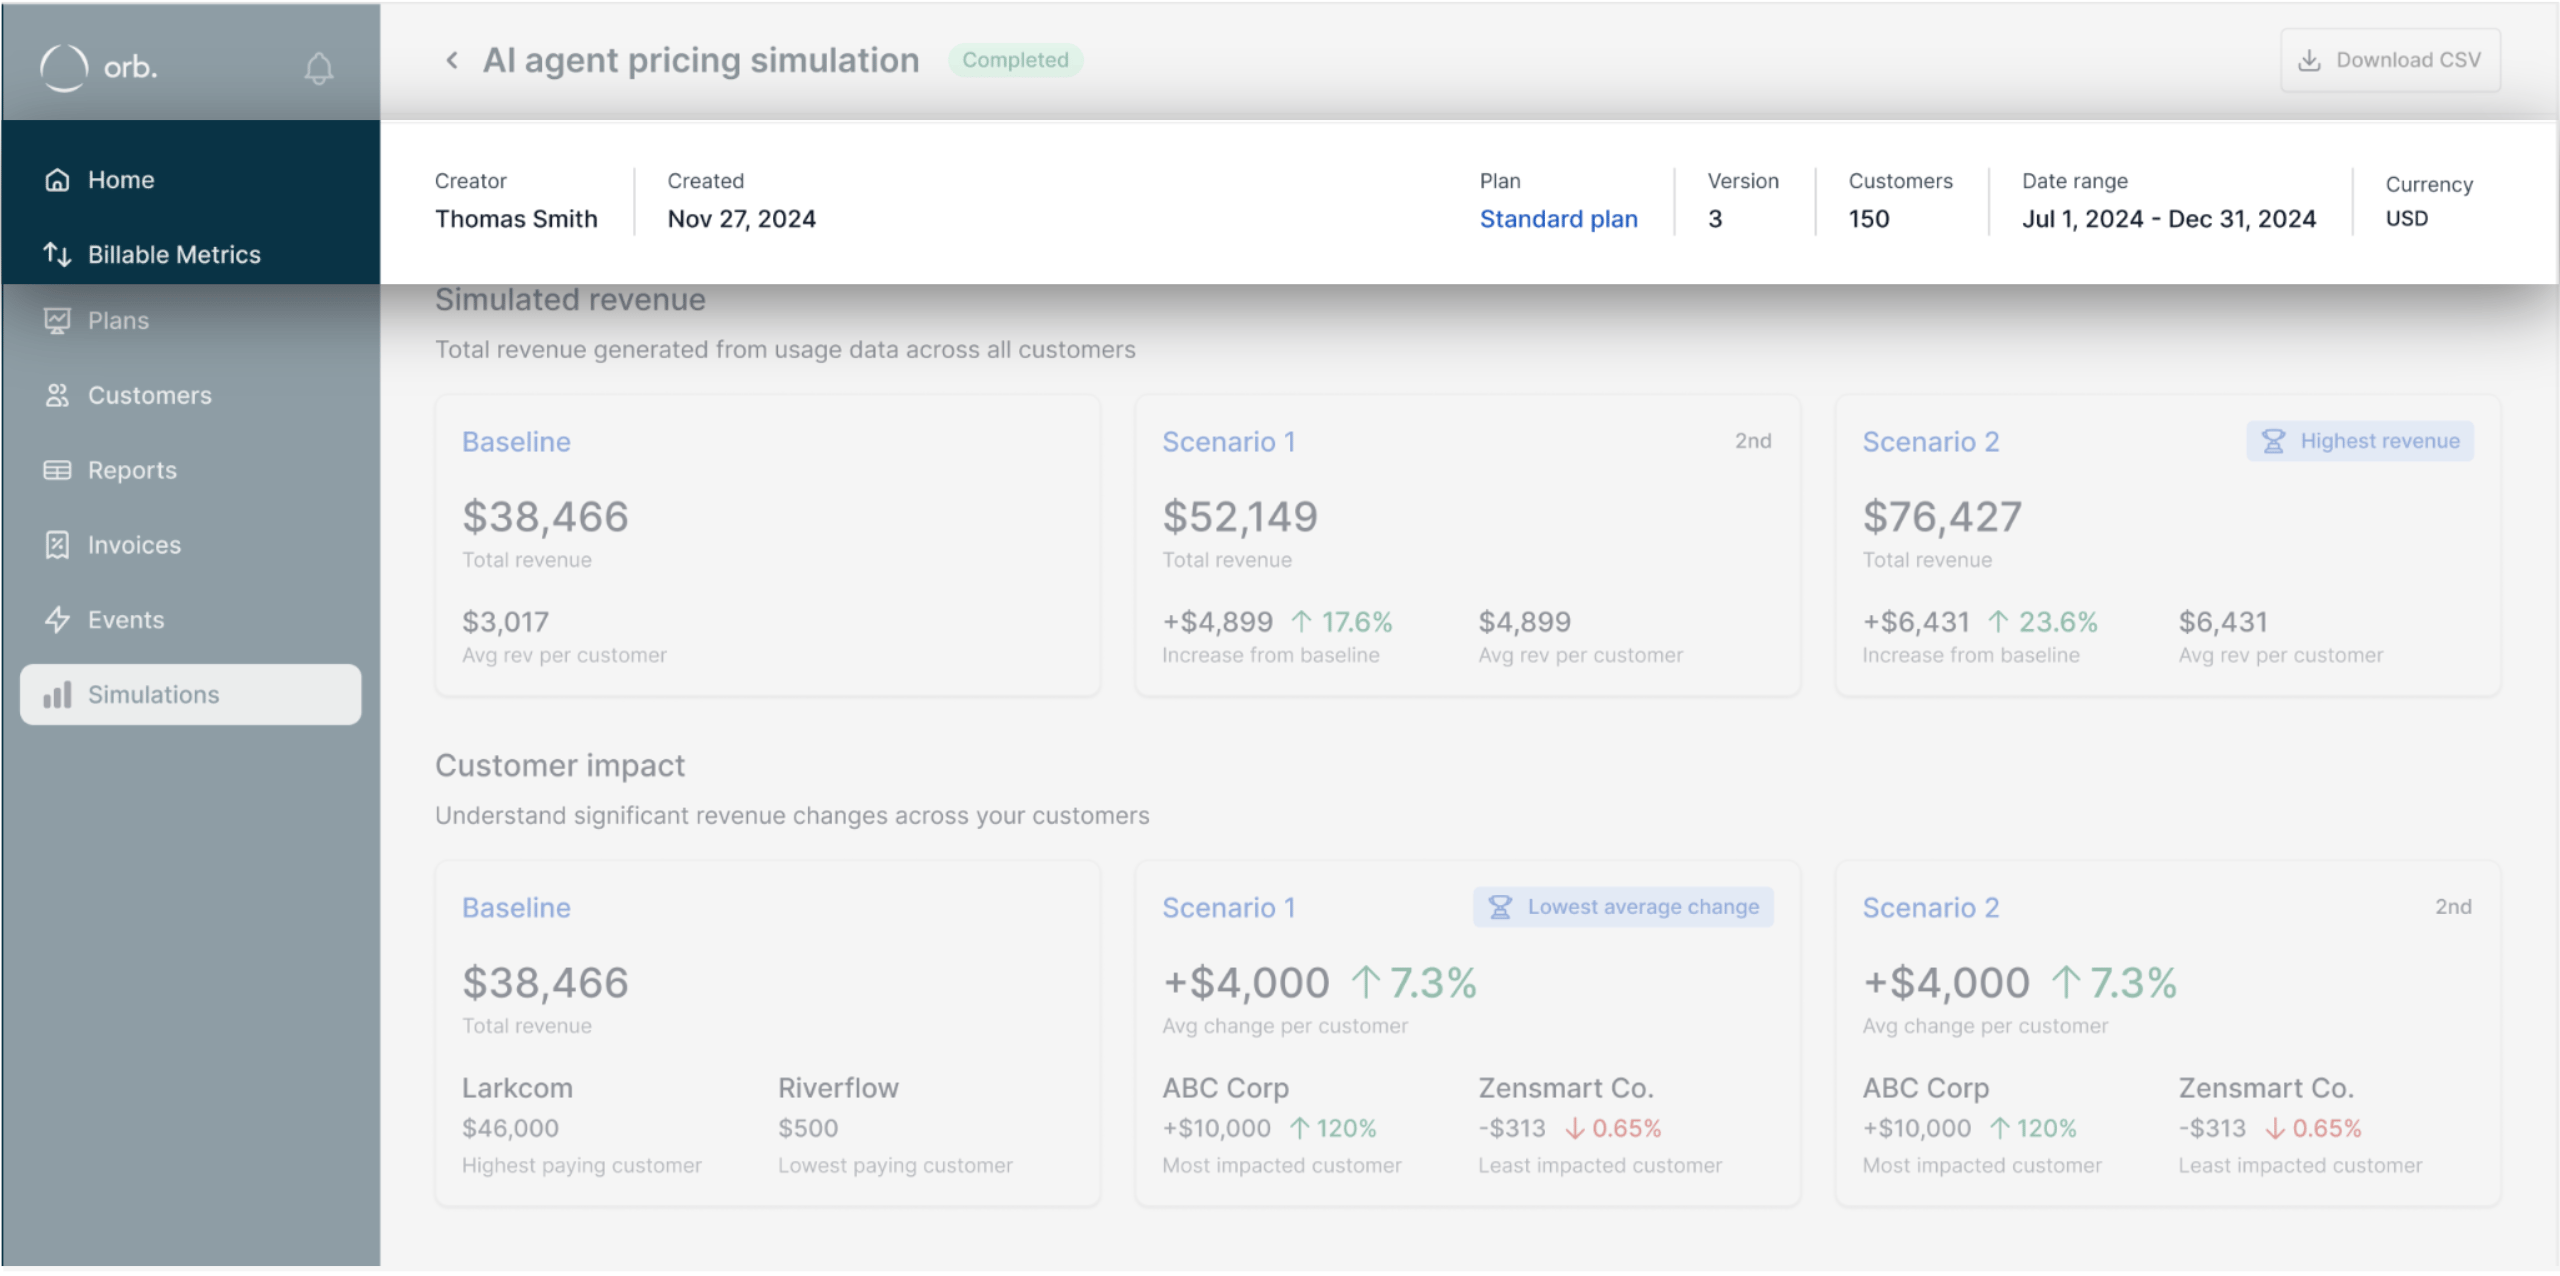
Deeper insights
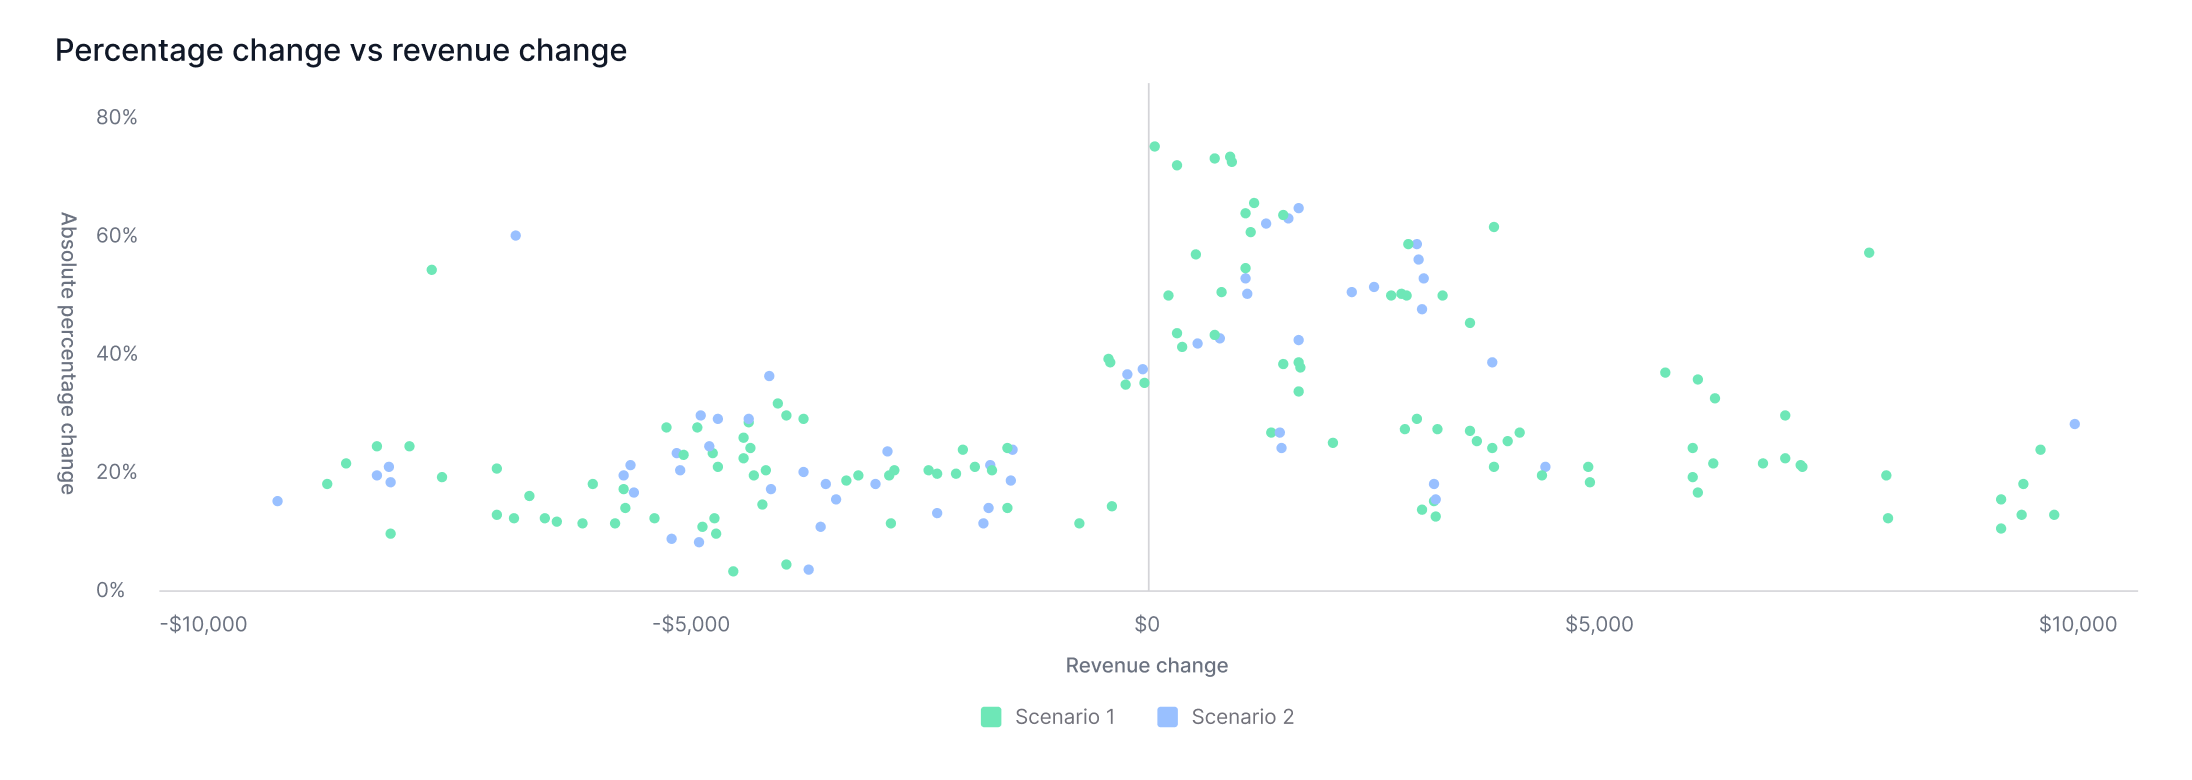
Monitoring how incremental revenue changes over time across scenarios helps to diagnose unexpected variability, identify seasonality impacts, and illuminate foundational product usage patterns to consider. Typically, you’ll want to aim for a smooth and consistent revenue curve over time. Inconsistent revenue spikes may suggest this price change is not in line with your optimal monetization strategy.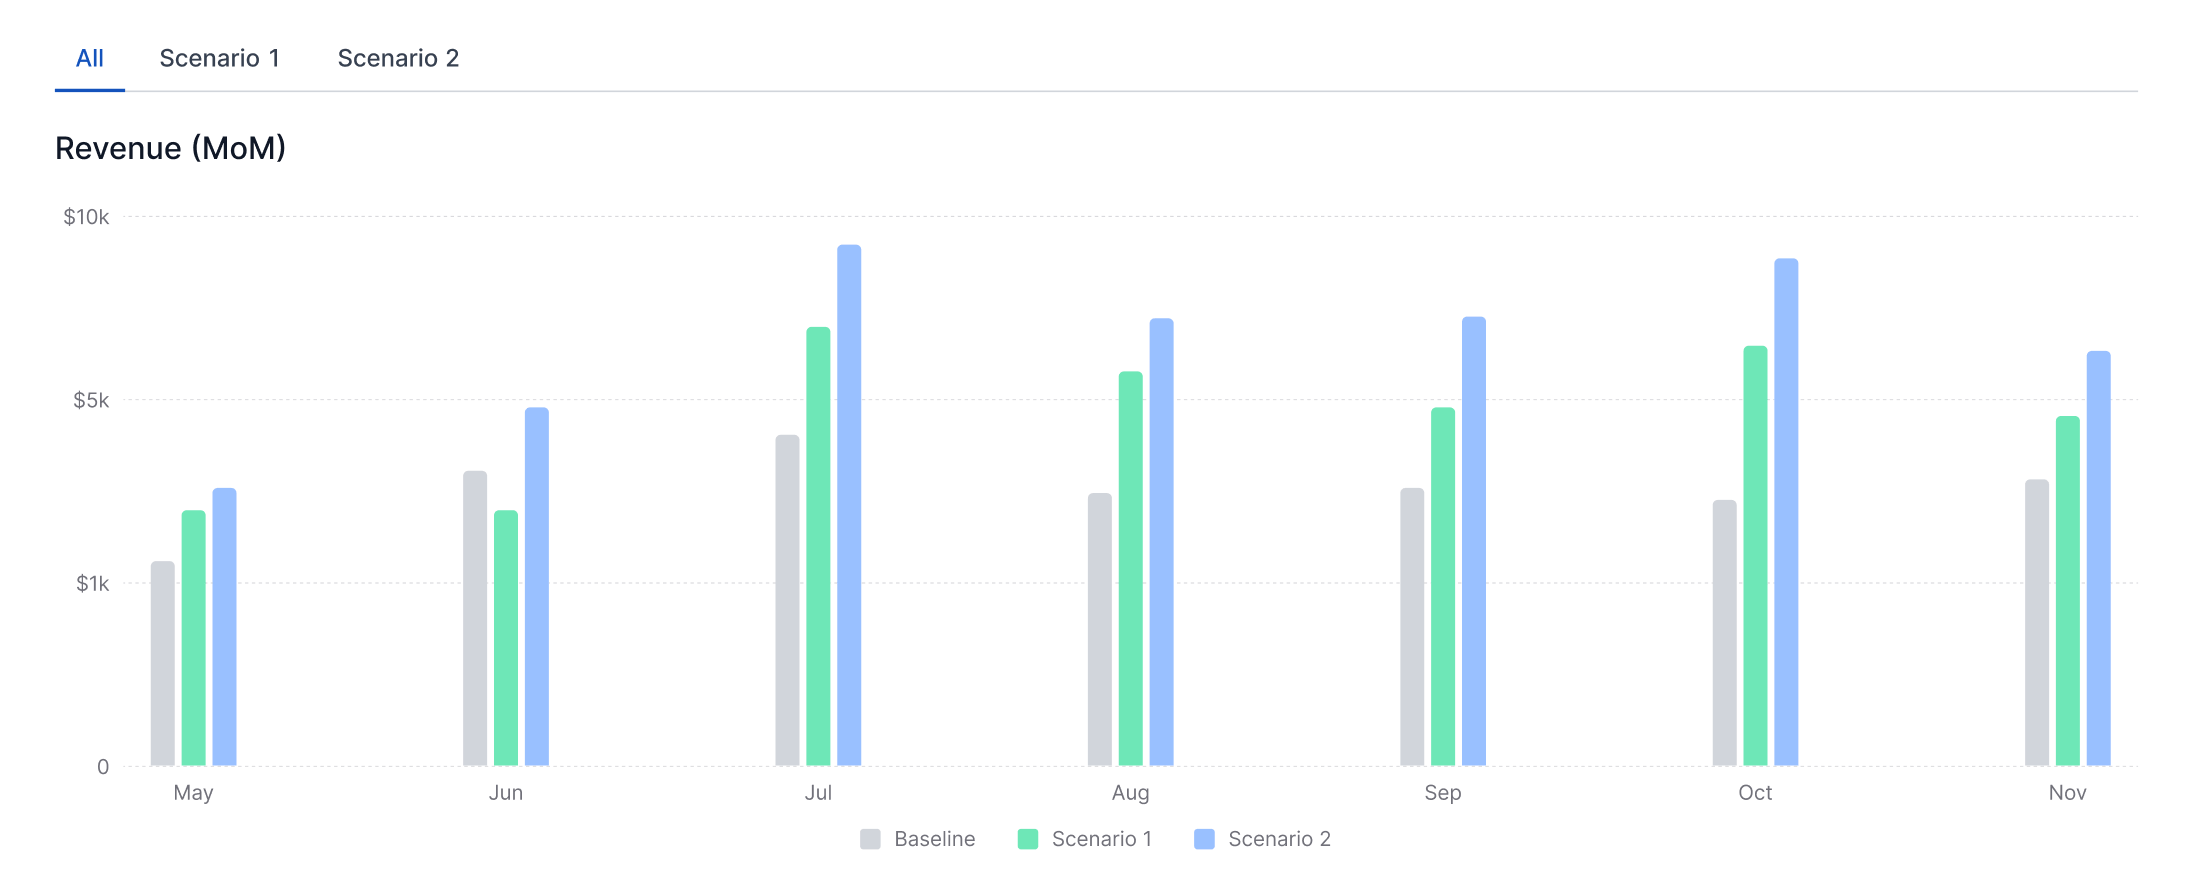
- Look at historical subscription(s) and invoices to understand customer LTV
- Create a new plan version or price override to accommodate exceptions
- Control migrations of affected customers to a plan version, while grandfathering marquee customers on existing plans if needed