Usage visualizations
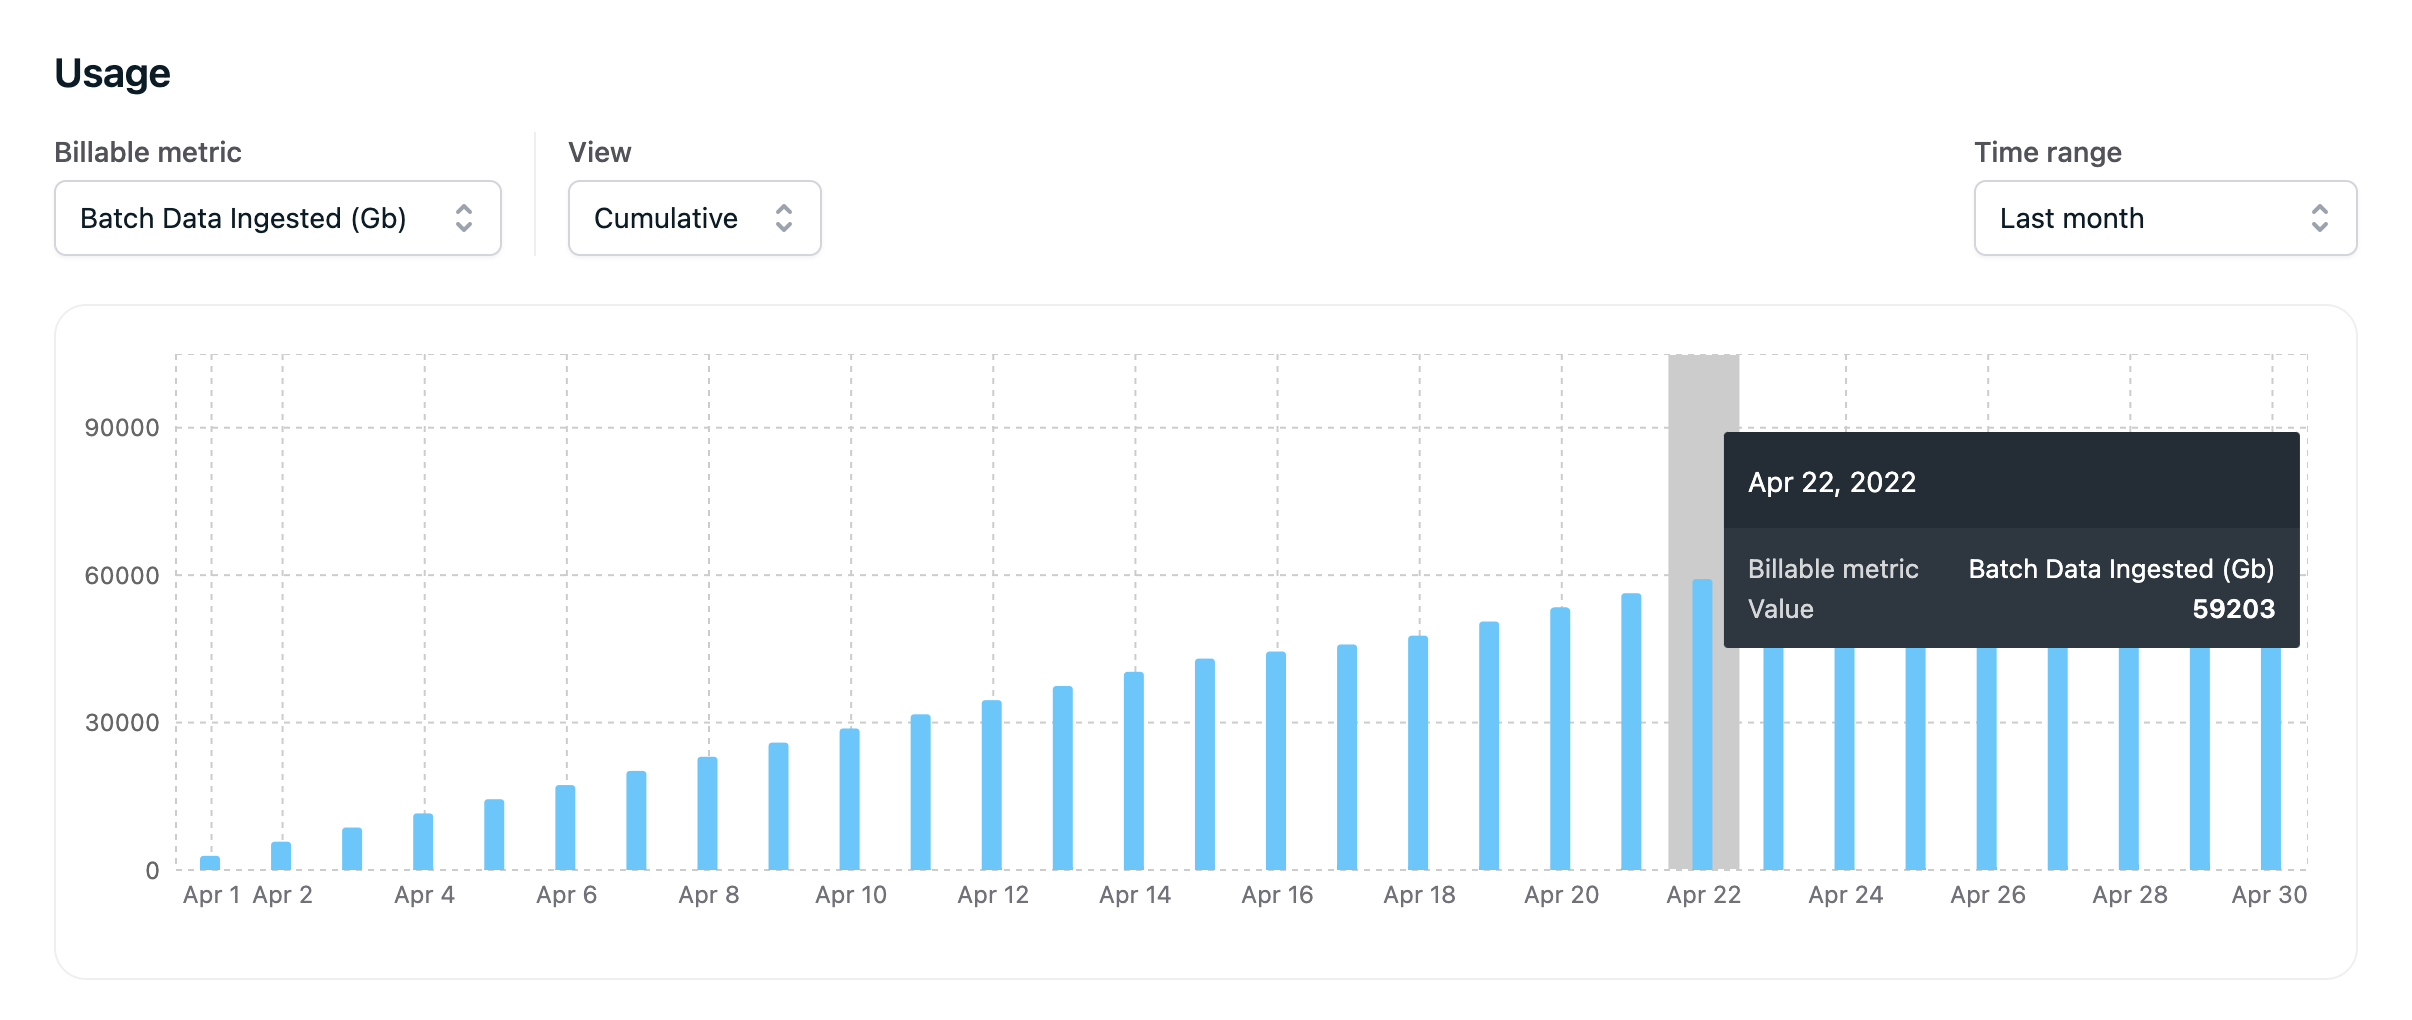
A subscription detail page presents usage in multiple formats:- Orb’s real time usage graphs show quantities split by day for each billable metric connected to the subscription. This view always displays fresh results on the basis of all events that have been ingested by the system. If your subscription’s plan charges for compute and storage costs, you will be presented a separate daily graph for both metrics. These graphs also allow you to view historical usage up to 90 days in the past, and compare trends with the previous billing cycle.
- The invoice preview shows the upcoming invoice resource for this billing period, with details on fixed fees, usage quantities, and the total amount for each line item. When working with a prepaid plan, the invoice preview will also show deductions to the balance over the current billing period.
- Historical invoices show finalized invoice PDFs. Invoice PDFs contain a breakdown of all line items along with billing metadata, tax information. Note that once an invoice PDF is finalized, its amounts are frozen. For auditing reasons, Orb will not dynamically regenerate a finalized invoice.