Why query-based metrics matter: Because metrics are queries (not pre-aggregated counters), you can create a new metric today and Orb instantly calculates it across all historical usage—no re-ingestion required. Product teams can experiment with different billing models, Finance can create retroactive metrics for analysis, and Engineering never needs to rebuild pipelines when pricing strategy changes.
Simple count
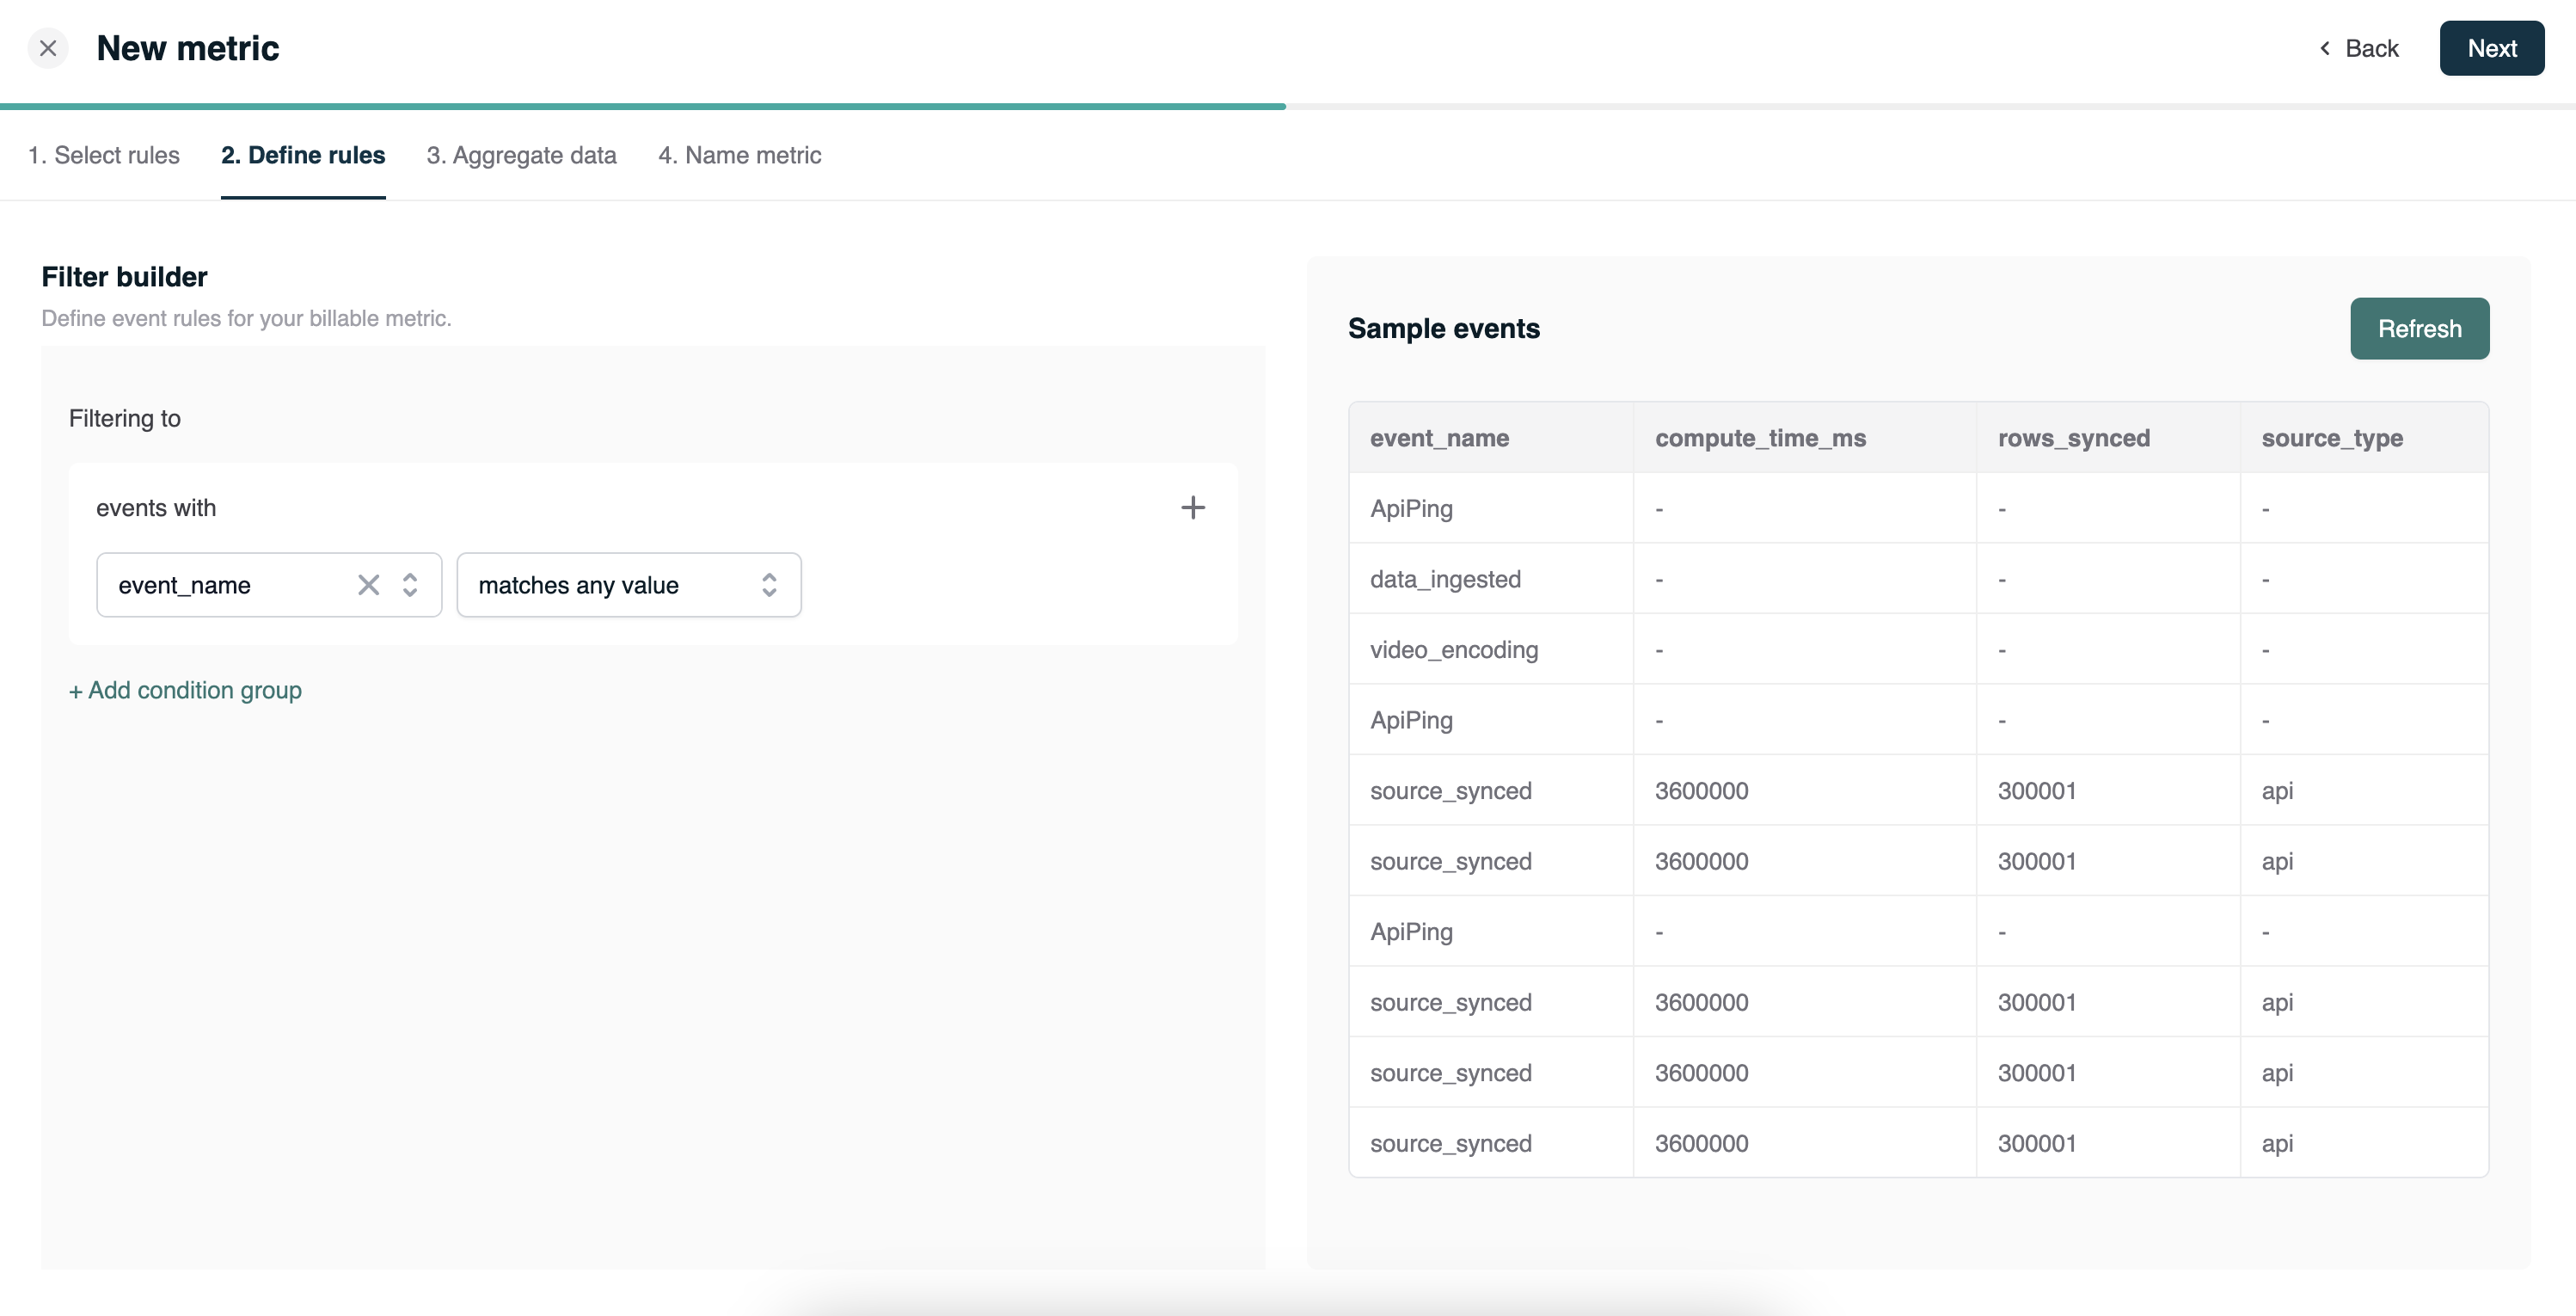
To get started, let’s create a billable metric that just counts all the events you’ve ingested.- Navigate to the metric creation page by clicking “Billable Metrics” in the left sidebar and then ”+ New metric”.
- Select “Simple event filters”
- Update the
event_namefilter to “matches any value”. - Click “Preview” to see a sample of usage events — here, you’ll see the events you’ve ingested into your account.
- Click “Next” and ensure the calculation type is set to “Count”
- Click “Next”, and enter “Count all events” for the name.
- Under “Item”, fill in “Count” then click “Publish”.
Refining your metric
We‘ve now created a billable metric, so now let’s start tuning the attributes of the metric. With these attributes, you’ll be able to refine your metric to meet the needs of your business. A billable metric is composed of filters and an analysis function. Filters enable you to only consider the events relevant to your metric. The analysis determines how Orb turns all of the filtered events into a single number. The “Count all events” metric didn’t filter out any events and the analysis was just a count. Let’s create a new metric that filters to a single event name and counts the distinct values of an event property you’ve ingested:- Navigate to the metric creation page under ”+ New Metric” > “Simple event filters”.
- Update the
event_namefilter to match a single event name. If you don’t remember which events you’ve ingested, feel free to preview with a “matches any” filter and pick one. - Once selected, hit “Next” to proceed to the next page.
- Update the “Calculation” to “Unique”.
- Set “Over property” to a property you’ve ingested where there are multiple distinct values.
- The “Sample events” pane will automatically update when you set this property.
- Click “Next”, and name the metric “Count distinct”.
- Under “Item”, fill in “Count distinct” then click “Publish”.
event_name you selected will not be considered in the analysis. The output of the analysis will depend on the values of the property you selected.
Note that you’ll never need to explicitly include a filter for the customer or time range, because Orb will always include those filters when evaluating a metric in the relevant context. For example, based on the plan in which the metric is used, the same billable metric may be evaluated over a monthly
or quarterly time range.
Advanced metrics
Computed properties
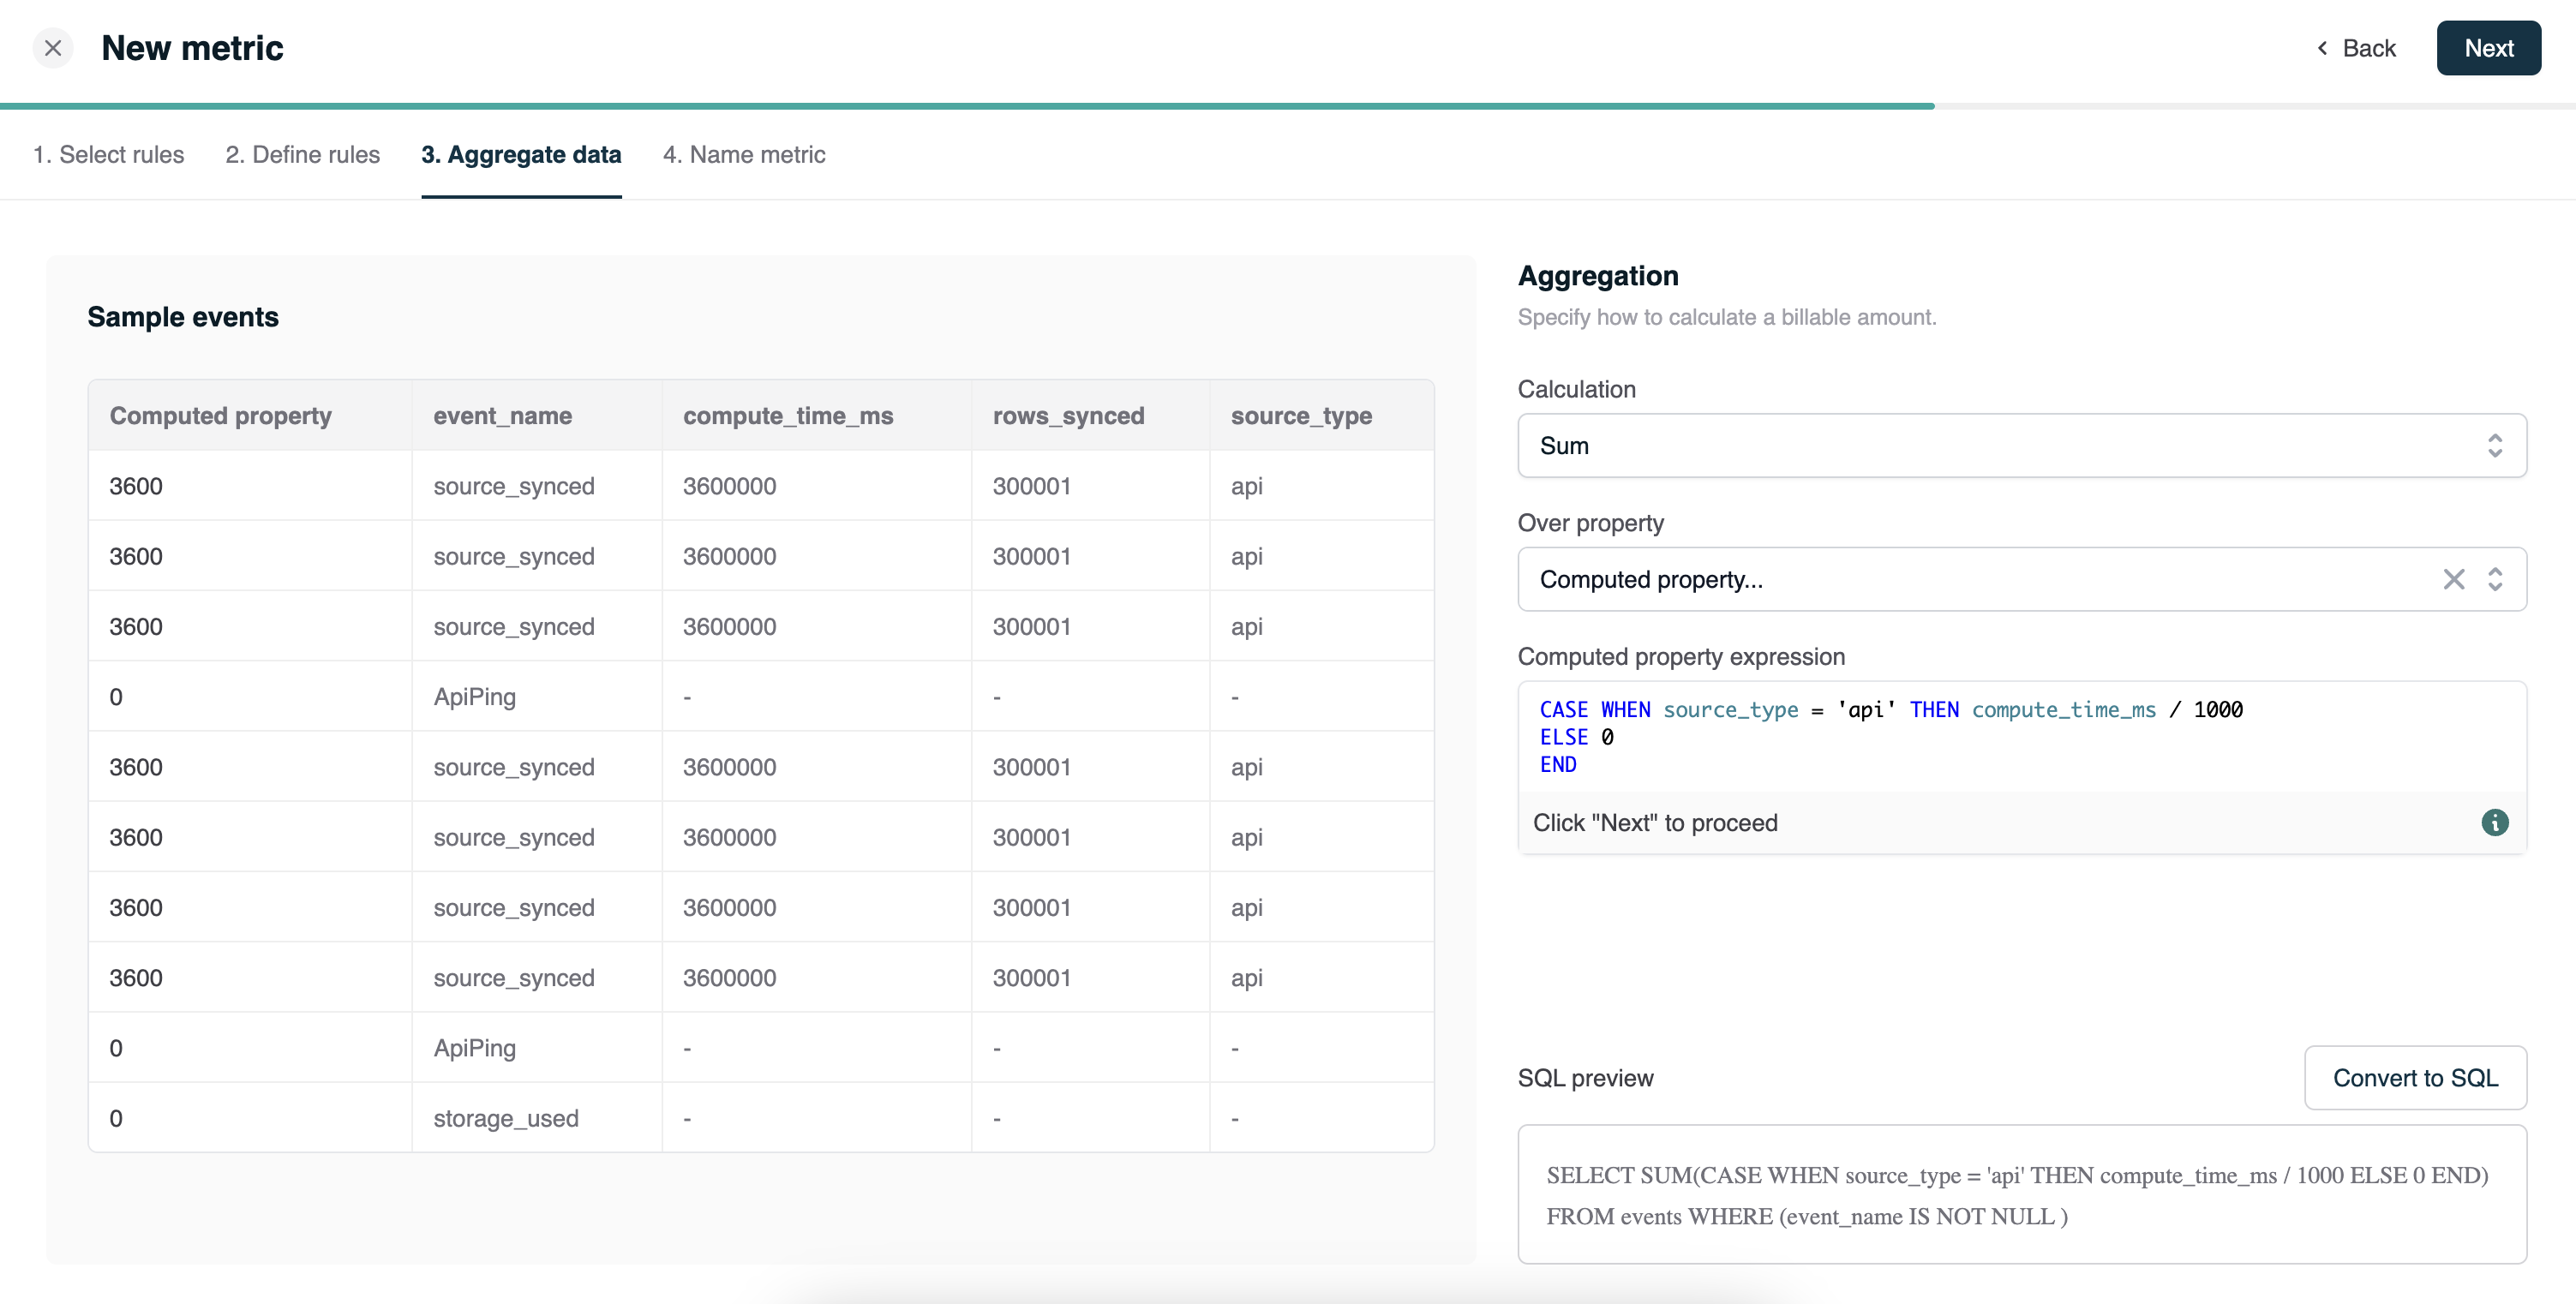
If you want to aggregate over a transformation of properties in your usage events, Orb supports computed properties. When defining the aggregation for your metric, instead of selecting an event property, select “Computed property…” at the top of the list. This will open an editor where you can define the transformation. For example, if you provided file storage as part of your offering and wanted to charge for megabytes downloaded, but your event property isbytes_downloaded, you could use a computed property: bytes_downloaded / 1000000. Conditional expressions are also supported, so if you wanted to charge double for fast downloads (denoted by download_speed: fast in the event properties), you might configure the following computed property:
Custom SQL
Although the basic Orb interface allows you to configure metrics with a series of conditional statements and some preset analysis functions, you may want to define a metric that is more complex. Just as with the basic definitions, Orb automatically parses the SQL you provide and appends the filters for a specific customer and timeframe when evaluating the metric in the context of a subscription. Orb’s web application allows you to switch to SQL, exposing the underlying custom SQL editor. You can do this by clicking the “Convert to SQL” button during the data aggregation step or by selecting a “Custom SQL query” at the beginning of the metric creation flow. In the SQL editor, you can define a query over the tableevents. For example, counting all events would look like:
events table. For example, if a file storage company wanted to charge for the number of distinct file paths downloaded more than 100 times, they could use the following metric: